Hello everyone!
Here’s a release update for all of you: you’ll now be able to download your event logs from Apilio! This will allow you to analyse when your devices are connecting, what’s the evolution of the data collected by your sensors,estimate how much power your devices are using at home… These are just some ideas to get you inspired ![]()
Where can I download my logs?
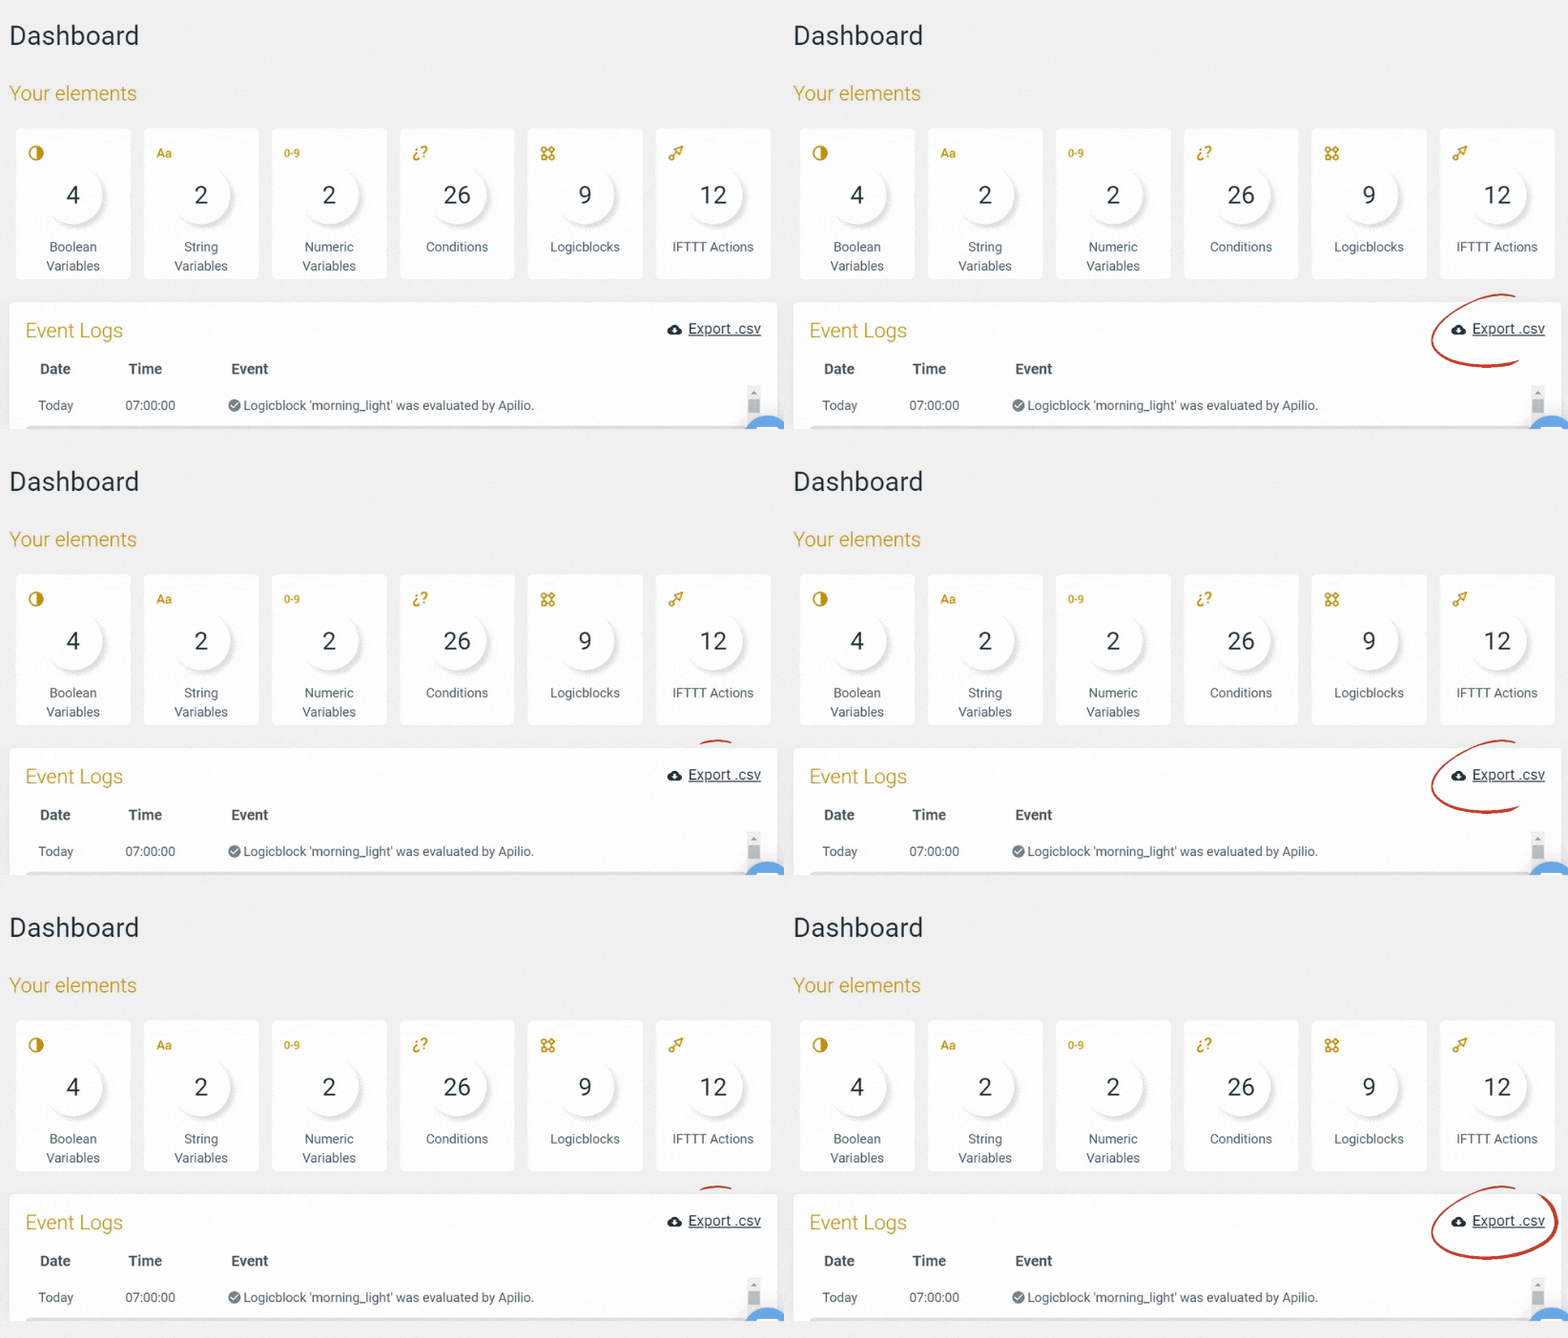
Go to your dashboard ![]() https://app.apilio.com/dashboard
https://app.apilio.com/dashboard
You’ll find the download button where your logs start click on the “export.csv” button:

How can I use my downloaded logs from Apilio?
Download and analyse your data with the spreadsheet software of your choice. You could filter for example events that signal when you get home and when you are leaving, all the events that updated a specific variable, or when a Logicblock is usually evaluating.
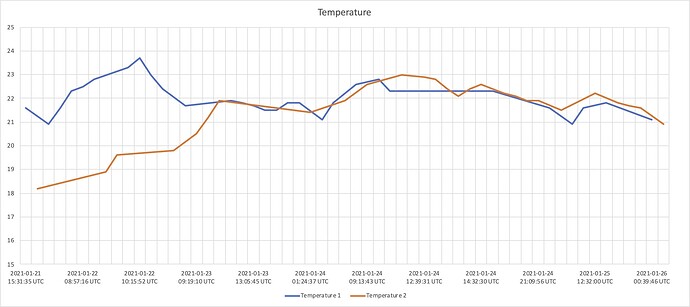
You can for example create a chart with any temperature updates from your sensors: use a variable to store any temperature changes, and then extract the logs, filter by this device in your spreadsheet, and plot away!
This is an example from @pebneter’s temperature sensors: here we are plotting the data from two Zigbee sensors:
What are the events I can find in my logs?
You’ll find the full list in our article when we introduced the logs for the first time here:
What’s the limit to the logs I can download?
For this first release, we implemented a simple download system to see what the Community builds with it and if thing anything is missing in order to have more control and monitoring of your home automations. Because this is the first release, we have limited the log entries that you can export at one given time to 6k lines.
Just so you get a sense of how much this is, my home routines generate about 250 logs every day, but @pebneter generates a whooping 8.5k lines of logs every day. Talk about smart, smart home, right? ![]()
I want more cool things for my logs!!
And so do we! ![]() Please let us know in the comments below how you are using your new shiny CSVs of logs and what you’d like to see next.
Please let us know in the comments below how you are using your new shiny CSVs of logs and what you’d like to see next.
Related articles


