When it comes to controlling your smart home devices, we know how important it is be able to check when your devices are being turned on or off, when is a particular routine running, or if everything is going alrighty.
Apilio registers changes to your variables and when your Logicblocks are running so you can check how things are going.
What can I use my logs for?
- When setting up new smart home automations, to verify that everything is running as it should
- Check that a particular Logicblock was executed when you expected it to
- Keep track of any IFTTT actions that are not connected to an Applet
- Analyse when your devices are usually turned on/off, create graphs with the evolution of your temperature variables… go crazy with any sweet, sweet data analysis (we love this!)
Where can I see/download my logs?
Go to your dashboard ![]() https://app.apilio.com/dashboard
https://app.apilio.com/dashboard
You’ll find your logs on the second half of your dashboard, and the download button at the top of where your logs start. Click on the “export.csv” button:
You will also find them in each variable and Logicblock show views: these are logs that are relevant to that variable or Logiblock.
How many hours/days/weeks of logs are you storing for me?
Depending on the plan you are on, we’ll store a different amount of logs for you. You can check the amount of logs your plan has available in our pricing page: https://www.apilio.com/pricing
What details can I see in my logs?
These are the events that are currently available in your logs:
1) A variable was successfully updated
Apilio receives a request from IFTTT or via a webhook to do update a variable, and it is then updated successfully. This event is only displayed after the successful update has happened.
You’ll be able to see:
- When a boolean variable has been updated to true, false, or toggled
- When a string variable has been updated or cleared
- When a numeric variable has been updated
2) A logicblock was successfully evaluated
This is displayed when Apilio evaluates successfully a logicblock, following a request from IFTTT or via an external webhook. You’ll also see if the Logicblock evaluated true or false.
3) An action was successfully sent to IFTTT
As a result of executing a logicblock, if the conditions for running any actions are met, Apilio sends a request to IFTTT to run an action, sending the event name that you specified.
4) A variable could not be updated
This is displayed if Apilio fails to update a variable following a request from IFTTT, for example, if a string variable is too long and cannot be saved.
5) A logicblock could not be evaluated
Apilio fails to evaluate a logicblock following a request from IFTTT. This can happen for example if your account is receiving too many requests (we will always contact you if we see any suspicious/excessive activity).
6) An action is not connected with an active IFTTT applet
If Apilio sends an action request to IFTTT but there isn’t an active applet listening for this event, then the action will fail because it is not activating anything connected with your IFTTT services.
7) You have reached your plan’s rate limit
If you are on our Pro or Essentials Plans , you can send/receive updates every second. If you are on our Free Plan , every minute. If your account reaches its limit, we will temporarily disable it as a protection against this suspicious activity.
Downloading your logs as a CSV file
You can download your logs from your Apilio dashboard: https://app.apilio.com/dashboard
Is there a limit to the logs I can download?
As this is a recent feature, we have limited the export to 6k lines of logs.
Just so you get a sense of how much this is: I (@Anna) generate about 250 lines of logs per day, and @pebneter generates about 8.5k lines of logs.
How to analyse your CSV file
You can analyse your CSV file with any spreadsheet software, such as Google Sheets, Open Office or Microsoft Excel.
Once you have downloaded your CSV file, go ahead and open it with your spreadsheet app of choice.
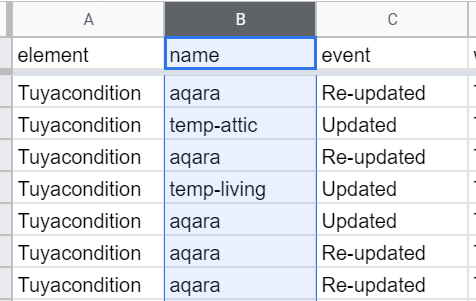
Filter by name to find a specific condition/device
- Select the column “name”:
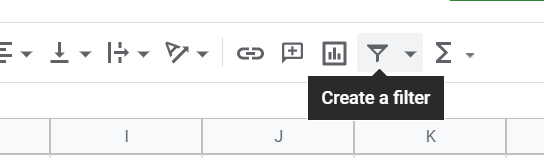
- Apply the filter option. On Google Sheets, it looks like this little funnel below. Here you can just click on this funnel, while the “name” column is selected, to apply the filter:
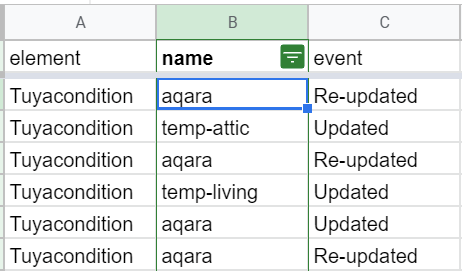
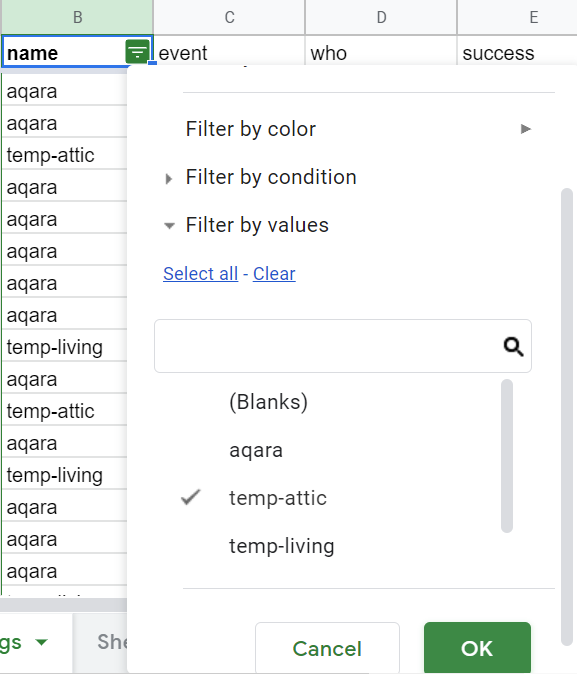
- You’ll see a green triangle appear at the top of the column. This allows you to filter by the different values available in this column:
- For example here I am selecting the attic temperature sensor:
This is helpful to go over the data for one particular sensor or condition.
You can see these filtered events also in Apilio: if you navigate to the variable you’d like to analyse, open the “show” view to see the event list that is relevant to this variable only. You can also download these events as well from that table of events.
Plotting data
If you have downloaded your full logs, you might want to compare for instance how your temperature sensors are doing across your home.
You can select multiple sensors and plot them against the time using a line chart for example:
- Quick way: By filtering the column with the sensor name you want, an copying the temperature data and timestamps to another sheet, and doing this with each sensor you want, against time.
- More involved way, but you can reuse/edit the expressions you create going forward: By using IMPORTRANGE (here’s the documentation from Google on how to use IMPORRANGE) you can pull data from several sheets into one.
For example, here’s a chart from two temperature sensors at @pebneter’s home:

Got any questions?
Leave them below! ![]()
Related articles
